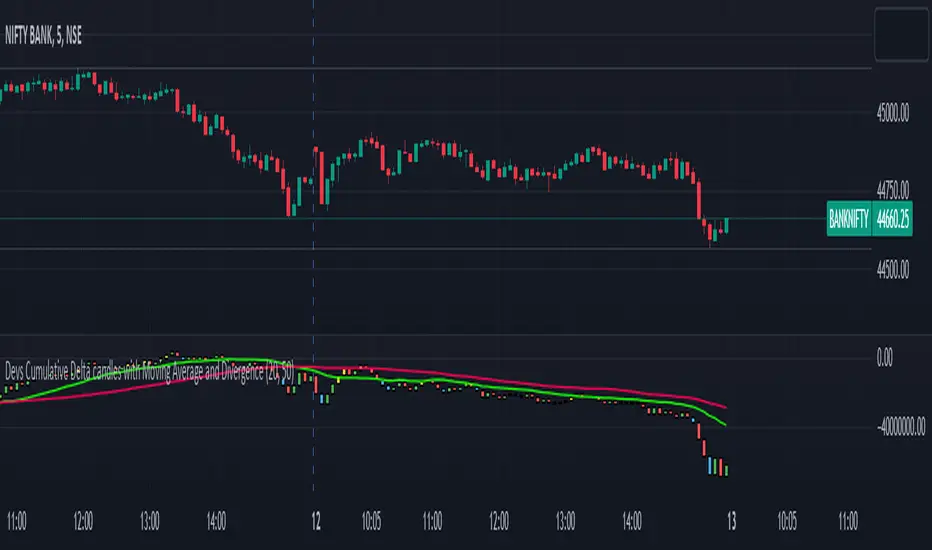
Devs Cumulative Delta candles with Moving Average and DivergenceDELTA = BUY Volume – SELL Volumes
Delta = Positive => Aggressiveness on the Buy side
Delta = Negative => Aggressiveness on the Sell side
If delta is greater than 0 you have more buying than selling pressure. If delta is less than 0, you have more selling than buying pressure.
When there is more Buying than Selling (Delta=Positive), the price candle is Green and when there is more Selling than Buying (Delta=Negative), the price candle is Red. We use delta to understand the relationship between buying or selling pressure and price.
Let’s imagine a price bar that reached the low for the day but delta was actually positive and the bar closed higher than it opened.
In simple terms we can describe this as:
Price made a new low
The bar closed higher
Delta demonstrated more buying than selling : Volume delta is a key metric to understand when making trading decisions based on volume and order flow. However, on its own it can be too much information to interpret quickly when trading in a volatile market.
What are Delta Bars?
Delta Bars is a candlestick representation of Delta. In other words, it has an Open, High (also called Delta Max), Low (also called Delta Min) and Close point in every candle (1min, 5min, 30min etc.)
The Delta Open in every candle is always 0
The Delta Close is the cumulative BUY less cumulative SELL at the close if the candle
The Delta Max is the maximum value of Delta during the candle session (lowest Delta Max possible = 0)
The Delta Min is the minimum value of Delta during the candle session (highest Delta Min possible = 0) The Delta bars are uncorrelated to the Tick Multiplier of the symbol.
Generally you would expect Price to move UP when Delta is positive and Price to move DOWN when Delta is negative. So what happens when the above rule is not followed. We have Divergence
Divergence:
Any two parameters that should be in sync (Price and Delta in this case) towards supporting a particular move (Up or Down) but are in reality not (in sync) form a Divergence
Cumulative volume delta takes the delta values for every bar and successively adds them together to visually provide as seen in the chart.
While volume delta is great for comparing delta bar to bar, cumulative volume delta is useful when determining buying or selling pressure at different price levels such as swing highs or lows. I just gave you a details regarding delta and delta bars.
What details would you see in the indicator??
When you apply this indicator on the chart, you will find the CD(Cumulative delta) candles, which move up and down the way price moves in a chart. Moreover, in case of a divergence, you will find a change in colour of delta candles. If the price is still green but the delta is negative, you will find a bullish divergence, marked with Yellow colour and if the price is red and you have a positive delta, you will have a bearish divergence, marked with blue coloured delta candle. Usually it has been seen that a repeated divergence generally depicts end of a trend or slow down of a trend.
Moreover, I have placed 2 moving averages in the script which you can customize as per your needs. I prefer 20 and 50 day MA for better accuracy as most reversals happen at 20 and 50 day MA.
This indicator works in almost all index, stocks, currencies excepting few where the volume past is invisible. This indicator purely works taking the buying and selling volume into consideration. Sometimes when you change the timeframe in chart, you may have to manually adjust for the display in chart.
在脚本中搜索"VOLUME DELTA"
Tick-Based Delta Volume BubblesTICK-BASED DELTA VOLUME BUBBLES
OVERVIEW
A real-time order flow indicator that displays volume delta at the tick level, helping traders identify buying and selling pressure as it develops during live market hours. Unlike traditional volume delta indicators that rely on bar close data, this indicator captures actual tick-by-tick volume changes and directional bias, providing granular insight into market dynamics.
HOW IT WORKS
The indicator monitors live tick data during real-time trading by tracking volume increases between consecutive price updates. Each time volume increments, the script calculates the volume delta, determines price direction, assigns directional bias to the volume, and accumulates net delta for each bar.
This methodology is identical to the tick detection mechanism used in professional cumulative volume delta tools, ensuring accuracy and reliability.
FEATURES
Real-Time Tick Detection
- Captures genuine tick-by-tick volume flow using varip persistence
- Not estimated from OHLC data
- Processes actual market ticks as they occur
Adaptive Bubble Sizing
- Bubbles scale based on delta strength relative to a customizable moving average (default 20 bars)
- Highlights significant order flow imbalances
- Five size levels from tiny to huge
Dual Display Modes
- Normal Mode: Sized bubbles with optional volume labels positioned at bar midpoint
- Minimal Mode: Clean dots above/below bars for unobtrusive delta visualization
Flow Classification
- Aggressive Buy (bright green): Strong positive delta with greater than 1.2x strength
- Aggressive Sell (bright red): Strong negative delta with greater than 1.2x strength
- Passive Buy (light green): Moderate positive delta
- Passive Sell (light red): Moderate negative delta
Intensity Mode (Optional)
- Gray: Low intensity (less than 0.5x average)
- Blue: Medium intensity (0.5-1.0x average)
- Orange: High intensity (1.0-2.0x average)
- Red: Extreme intensity (greater than 2.0x average)
Smart Filtering
- Percentile-based filters (customizable) ensure only significant delta events are displayed
- Reduces chart clutter while highlighting important order flow
- Separate thresholds for bubble display and numeric labels
Data Collection Status
- Optional progress box in top-right corner
- Shows real-time bar collection progress
- Displays percentage completion and bars remaining
- Automatically hides when sufficient data is collected
Hide Until Ready Option
- Suppresses bubble display until the averaging period is complete
- Prevents misleading signals from incomplete data
- Default requires 20 bars before displaying bubbles
SETTINGS
Delta Average Length (1-200, default 20)
- Lookback period for calculating delta strength baseline
- Higher values = longer-term delta comparison
- Lower values = more sensitive to recent changes
Hide Bubbles Until Enough Data
- Prevents display until averaging period completes
- Ensures reliable delta strength calculations
Show Data Collection Status Box
- Displays progress indicator during initialization
- Can be disabled if you understand the warmup period
Minimal Mode
- Switches to simple dot display above/below bars
- Green dots above bars = positive delta
- Red dots below bars = negative delta
- Maintains color intensity or flow type classification
Show Bubbles
- Master toggle for bubble display
Bubble Volume Percentile (0-100, default 60)
- Minimum percentile rank required to display bubble
- Higher values = fewer, more significant bubbles
- Lower values = more bubbles displayed
Show Numbers in Bubbles
- Toggle delta value labels
- Only appears in normal mode
- Disabled automatically in minimal mode
Label Volume Percentile (0-100, default 90)
- Higher threshold for displaying numeric labels
- Typically set higher than bubble percentile
- Reduces label clutter on chart
Intensity Mode
- Switch from flow-type coloring to magnitude-based coloring
- Useful for identifying volume spikes regardless of direction
IMPORTANT NOTES
Real-Time Only: This indicator processes live tick data and does not provide historical analysis. It begins collecting data when added to a live chart.
Volume Required: Symbol must have volume data available. Will not function on symbols without volume (most forex pairs from retail brokers).
Initialization Period: Requires the specified number of bars (default 20) to calculate accurate delta strength. Use the "Hide Until Ready" option to prevent premature signals.
Market Hours: Only collects data during live market hours. Does not backfill historical data.
CREDITS
Tick detection methodology inspired by the Kioseff Trading Tick CVD indicator. This implementation adapts the same core tick-level volume delta calculation for bubble-style visualization and per-bar delta analysis.

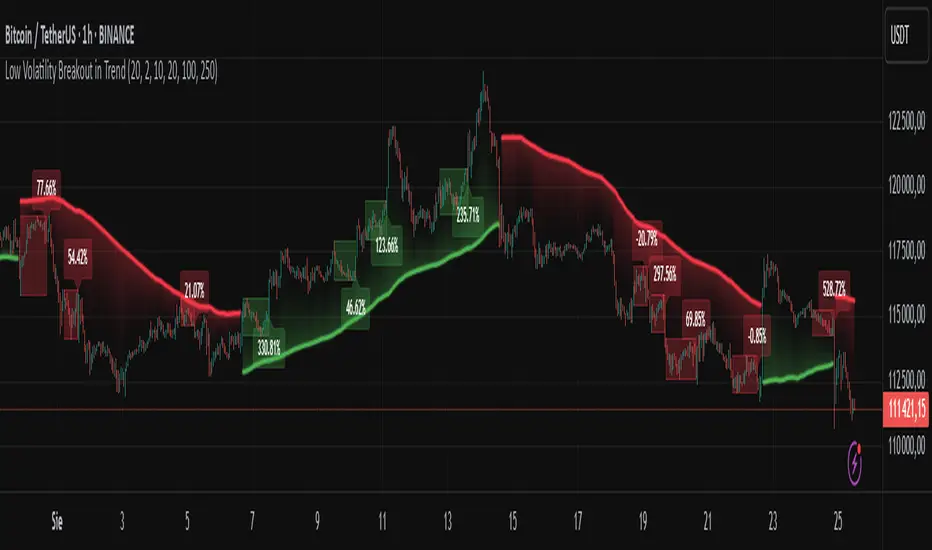
Low Volatility Breakout in Trend
█ OVERVIEW
"Low Volatility Breakout in Trend" is a technical analysis tool that identifies periods of low-volatility consolidation within an ongoing trend and signals potential breakouts aligned with the trend's direction. The indicator detects trends using a simple moving average (SMA) of price, identifies consolidation zones based on the size of candle bodies, and displays the percentage change in volume (volume delta) at the breakout moment.
█ CONCEPTS
The core idea of the indicator is to pinpoint moments where traders can join an ongoing trend by capitalizing on breakouts from consolidation zones, supported by additional information such as volume delta. It provides clear visualizations of trends, consolidation zones, and breakout signals to facilitate trading decisions.
Why Use It?
* Breakout Identification: The indicator locates low-volatility consolidation zones (measured by the size of individual candle bodies, not the price range of the consolidation) and signals breakouts, enabling traders to join the trend at key moments.
* Volume Analysis: Displays the percentage change in volume (delta) relative to its simple moving average, providing insight into market activity rather than acting as a signal filter.
* Visual Clarity: Colored trend lines, consolidation boxes (drawn only after the breakout candle closes, not on subsequent candles), and volume delta labels enable quick chart analysis.
* Flexibility: Adjustable parameters, such as the volatility window length or SMA period, allow customization for various trading strategies and markets.
How It Works
* Trend Detection: The indicator calculates a simple moving average (SMA) of price (default: based on the midpoint of high/low) and creates dynamic trend bands, offset by a percentage of the average candle height (band scaling). A price above the upper band signals an uptrend, while a price below the lower band indicates a downtrend. Trend changes occur not when the price crosses the SMA but when it crosses above the upper band or below the lower band (offset by the average candle height multiplied by the scaling factor).
* Consolidation Identification: Identifies low-volatility zones when the candle body size is smaller than the average body size over a specified period (default: 20 candles) multiplied by a volatility threshold — the maximum allowable body size as a percentage of the average body (e.g., 2 means the candle body must be less than twice the average body to be considered low-volatility).
* Breakout Signals: A breakout occurs when the candle body exceeds the volatility threshold, is larger than the maximum body in the consolidation, and aligns with the trend direction (bullish in an uptrend, bearish in a downtrend).
* Visualization: Draws a trend line with a gradient, consolidation boxes (appearing only after the breakout candle closes, marking the consolidation zone), and volume delta labels. Optionally displays breakout signal arrows.
* Signals and Alerts: The indicator generates signals for bullish and bearish breakouts, including the volume delta percentage. Alerts are an additional feature that can be enabled for notifications.
Settings and Customization
* Volatility Window: Length of the period for calculating the average candle body size (default: 20).
* Volatility Threshold: Maximum candle body size as a percentage of the average body (default: 2).
* Minimum Consolidation Bars: Number of candles required for a consolidation (default: 10).
* SMA Length for Trend: Period of the SMA for trend detection (default: 100).
* Band Scaling: Offset of trend bands as a percentage of the average candle height (default: 250%), determining the distance from the SMA.
* Visualization Options: Enable/disable consolidation boxes (Show Consolidation Boxes, drawn after the breakout candle closes), volume delta labels (Show Volume Delta Labels), and breakout signals (Show Breakout Signals, e.g., triangles).
* Colors: Customize colors for the trend line, consolidation boxes, and volume delta labels.
█ OTHER SECTIONS
Usage Examples
* Joining an Uptrend: When the price breaks out of a consolidation in an uptrend with a volume delta of +50%, open a long position; the signal is stronger if the breakout candle surpasses a local high.
* Avoiding False Breakouts: Ignore breakout signals with low volume delta (e.g., below 0%) and combine the indicator with other tools (e.g., support/resistance levels or oscillators) to confirm moves in low-activity zones.
Notes for Users
* On markets that do not provide volume data, the indicator will not display volume delta — disable volume labels and enable breakout signals (e.g., triangles) instead.
* Adjust parameters to suit the market's characteristics to minimize noise.
* Combine with other tools, such as Fibonacci levels or oscillators, for greater precision.
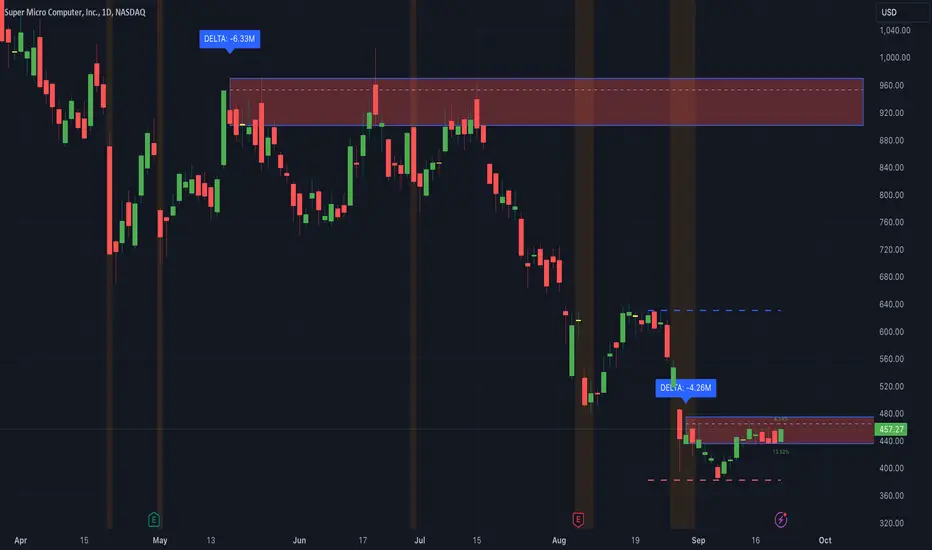
Thrax - Intraday Market Pressure ZonesTHRAX - INTRADAY MARKET PRESSURE ZONES
This indicator identifies potential support and resistance zones based on areas of significant market pressure. It dynamically plots these zones and adjusts their visibility based on real-time price action and user-defined thresholds. The indicator is useful for traders seeking to understand intraday market pressure, visualize zones of potential price reversals, and analyze volume imbalances at critical levels.
1. Support/Resistance Zones: Wherever the price retraces significantly from its high a support zone is drawn and when it retraces significantly from it low a resistance zone is drawn. The significant retracing is measured by the wick threshold percentage. For instance, if set to 75%, it implies price retracement of 75% either from high or from low for a particular candel
Volume delat: Displays volume delta information where the zones are formed. This can be used by trader to consider only those zones where delta is significant.
2. Breakout Detection: Monitors for price breakouts beyond established zones, deleting zones that are invalidated by price movement. when the price breaks a given zone with the threshold, it is considered to be mitigated and chances of trend continuation is decent.
Candle Coloring: Uses color codes (green, red, and yellow) to represent bullish, bearish, and indecisive (doji) candles, aiding quick visual assessment.
INPUTS
1. Wick Threshold (%) : Sets the minimum wick percentage required for a candle to be considered a support or resistance candidate.
2. Breakout Threshold (%) : Determines the percentage above or below a support or resistance zone that defines a breakout condition. if breaks a zone with the set threshold then the zone will be considered mititgated.
3. Max Number of Support/Resistance Zones : Limits the maximum number of support/resistance zones displayed on the chart, ranging from 1 to 5.
4. Show Wick Percentage Labels : Toggles the display of percentage values for upper and lower wicks on each candle.
TRADE SETUP
Identifying Entry Points: Look for the formation of support or resistance zones. Wait for price to retrace to these zones. if you are willing to take risk, you can consider even zones with low delta. If you want to be more cautious you should consider zones with high delta.
Volume Confirmation: Use the volume information to confirm the strength of the zone. Strong volume differences (displayed as labels) can indicate significant market pressure at these levels.
Breakout Trades: If price breaks through a support/resistance zone by more than the breakout threshold, consider this a signal for a potential trend continuation in the breakout direction.
Risk Management: Set stop-loss levels slightly outside of the identified zones to minimize risk in case of false breakouts. This can be set in input setting for breakout threshold.
Bonus Tip : Mark your significant highs and lows from where prices have retraced multiple times in the near past and if the zone is near these levels it can serve s a strong candidate of support or resistance
Therefore, in conclusion monitor the zones, based on delta and volume presence filter out the zone, wait for price retracement to the zone, intiate the trade with stop loss below zone with a set percentage.
Delta ZigZag [LuxAlgo]The Delta ZigZag indicator is focused on volume analysis during the development of ZigZag lines. Volume data can be retrieved from a Lower timeframe (LTF) or real-time Tick data.
Our Delta ZigZag publication can be helpful in detecting indications of a trend reversal or potential weakening/strengthening of the trend.
This indicator by its very nature backpaints, meaning that the displayed components are offset in the past.
🔶 USAGE
The ZigZag line is formed by connecting Swings , which can be set by adjusting the Left and Right settings.
Left is the number of bars for evaluation at the left of the evaluated point.
Right is the number of bars for evaluation at the right of the evaluated point.
A valid Swing is a value higher or lower than the bars at the left/right .
A higher Left or Right set number will generally create broader ZigZag ( ZZ ) lines, while the drawing of the ZZ line will be delayed (especially when Right is set higher). On the other hand, when Right is set at 0, ZZ line are drawn quickly. However, this results in a hyperactive switching of the ZZ direction.
To ensure maximum visibility of values, we recommend using " Bars " from the " Bar's style " menu.
🔹 Volume examination
The script provides two options for Volume examination :
Examination per ZigZag line
Examination per bar
Bullish Volume is volume associated with a green bar ( close > open )
Bearish Volume is volume associated with a red bar ( close < open )
Neutral Volume (volume on a " close == open" bar) is not included in this publication.
🔹 Examination per ZigZag line
As long as the price moves in the same direction, the present ZZ line will continue. When the direction of the price changes, the bull/bear volume of the previous ZZ line is evaluated and drawn on the chart.
The ZZ line is divided into two parts: a bullish green line and a bearish red line.
The intercept of these two lines will depend on the ratio of bullish/bearish volume
This ratio is displayed at the intercept as % bullish volume (Settings -> Show % Bullish Volume)
* Note that we cannot draw between 2 bars. Therefore, if a ZZ line is only 1 bar long, the intercept will be at one of those 2 bars and not in between. The percentage can be helpful in interpreting bull/bear volume.
In the example above (2 most right labels), you can see that an overlap of 2 labels is prevented, ensuring the ability to evaluate the bullish % volume of the ZZ line .
The percentage will be colored green when more than 50%, red otherwise. The color will fade when the direction is contradictory; for example, 40% when the ZZ line goes up or 70% when the ZZ line falls.
More details can be visualized by enabling " Show " and choosing 1 of 3 options:
Average Volume Delta/bar
Average Volume/bar
Normalised Volume Delta
For both 'averages', the sum of " Volume "/" Volume Delta " of every bar on the ZZ line is divided by the number of bars (per ZZ line ).
The " Normalised Volume Delta " is calculated by dividing the sum of " Delta Volume " by the sum of " Volume " (neutral volume not included), which is displayed as a percentage.
All three options will display a label at the last point of the ZZ line and be coloured similarly: green when the ratio bullish/bearish volume of the ZZ line is bullish and red otherwise. Here, the colour also fades when it is bullish, but the ZZ line falls or when it is bearish with a rising ZZ line .
A tooltip at each label hints at the chosen option.
You can pick one of the options or combine them together.
🔹 Examination per bar
Besides information about what's happening during the ZZ line , information per bar can be visualized by enabling " Show Details " in Settings .
Split Volume per bar : show the sum of bullish (upV) and bearish (dnV) volume per bar
Volume (bar) : Total Volume per bar (bullish + bearish volume, neutral volume not included)
Δ Volume (bar) : Show Delta Volume (bullish - bearish volume)
🔹 Using Lower Timeframe Data
The ZigZag lines using LTF data are colored brighter. Also note the vertical line where the LTF data starts and the gap between ZZ lines with LTF data and without.
When " LTF " is chosen for the " Data from: " option in Settings , data is retrieved from Lower Timeframe bars (default 1 minute). When the LTF setting is higher than the current chart timeframe, the LTF period will automatically be adjusted to the current timeframe to prevent errors.
As there is a 100K limit to the number of LTF intrabars that can be analyzed by a script, this implies the higher the difference between LTF and current TF; the fewer ZZ lines will be seen.
🔹 Using real-time tick data
The principles are mostly the same as those of LTF data. However, in contrast with LTF data, where you already have LTF ZZ lines when loading the script, real-time tick data-based ZZ lines will only start after loading the chart.
Changing the settings of a ticker will reset everything. However, returning to the same settings/ticker would show the cached data again.
Here, you can see that changing settings reset everything, but returning after 2 minutes to the initial settings shows the cached data. Don't expect it to be cached for hours or days, though.
🔶 DETAILS
The timeframe used for LTF data should always be the same or lower than the current TF; otherwise, an error occurs. This snippet prevents the error and adjusts the LTF to the current TF when LTF is too high:
res = input.timeframe('1')
res := timeframe.from_seconds( math.min( timeframe.in_seconds(timeframe.period), timeframe.in_seconds(res) ) )
🔶 SETTINGS
Data from: LTF (Lower TimeFrame) or Ticks (Real-time ticks)
Res: Lower TimeFrame (only applicable when choosing LTF )
Option: choose " high/low " or " close " for Swing detection
🔹 ZigZag
Left: Lookback period for Swings
Right: Confirmation period after potential Swing
🔹 ZigZag Delta
Show % Bullish Volume : % bullish volume against total volume during the ZZ line
Show:
Average Volume Delta/bar
Average Volume/bar
Normalised Volume Delta
See USAGE for more information
🔹 Bar Data
Split Volume per bar: shows the sum of bullish ( upV ) and bearish ( dnV ) volume per bar
Volume (bar): Total Volume per bar (bullish + bearish volume, neutral volume not included)
Δ Volume (bar): Show Volume Delta (bullish - bearish volume)

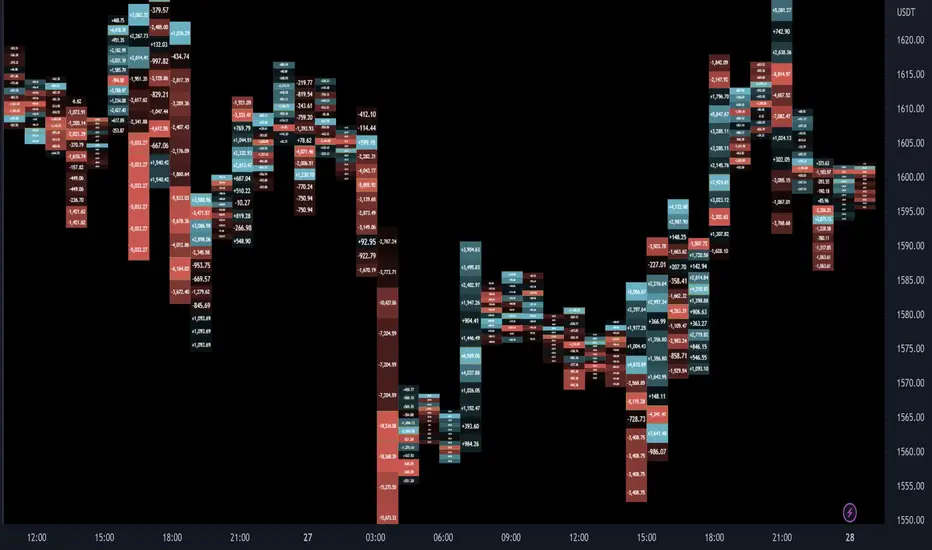
Delta Ladder [Kioseff Trading]Hello!
This script presents volume delta data in various forms!
Features
Classic mode: Volume delta boxes oriented to the right of the bar (sell closer / buy further)
On Bar mode: Volume delta boxes oriented on the bar (sell left / buy right)
Pure Ladder mode: Pure volume delta ladder
PoC highlighting
Color-coordinated delta boxes. Marginal volume differences are substantially shaded while large volume differences are lightly shaded.
Volume delta boxes can be merged and delta values removed to generate a color-only canvas reflecting vol. delta differences in price blocks.
Price bars can be split up to 497 times - allowing for greater precision.
Total volume delta for the bar and timestamp included
The image above shows Classic mode - delta blocks are oriented left/right contingent on positive/negative values!
The image above shows the same price sequence; however, delta blocks are superimposed on the price bar. Left-side blocks reflect negative delta while right-side blocks reflect positive delta! To apply this display method - select "On Bar" for the "Data Display Method" setting!
The image above shows "Pure Ladder" mode. Delta blocks remain color-coordinated; however, all delta blocks retain the same x-axis as the price bar they were calculated for!
Additionally, you can select to remove the delta values and merge the delta boxes to generate a color-based canvas indicative of volume delta at traded price levels!
The image above shows the same price sequence; however, the "Volume Assumption" setting is activated.
When active, the indicator assumes a 60/ 40 split when a level is traded at and only one metric - "buy volume" or "sell volume" is recorded. This means there shouldn't be any levels recorded where "buy volume" is greater than 0 and "sell volume" equals 0 and vice versa. While this assumption was performed arbitrarily, it may help better replicate volume delta and OI delta calculations seen on other charting platforms.
This option is configurable; you can select to have the script not assume a 60/ 40 split and instead record volume "as is" at the corresponding price level!
I plan to roll out additional features for the indicator - particularly tick-based price blocks! Stay tuned (:
Thank you!
Volume essential parameters overlayVolume EPO – Essential Volume Parameters Overlay
1. Motivation and design philosophy
Volume EPO is designed as a conceptual overlay rather than a self contained trading system. The main idea behind this script is to take complex, foundational market concepts out of heavy, menu driven strategies and express them as lightweight, independent layers that sit on top of any chart or indicator.
In many TradingView scripts, a single strategy tries to handle everything at once: signal logic, risk settings, visual cues, multi timeframe controls, and conceptual explanations. This usually leads to long input menus, performance issues, and difficult maintenance. The architectural approach behind Volume EPO is the opposite: keep the core strategy lean, and move the explanation and measurement of key concepts into dedicated overlays.
In this framework, Volume EPO is the base layer for the concept of volume. It does not decide anything about entries or exits. Instead, it exposes and clarifies how different definitions of volume behave candle by candle. Other layers or strategies can then build on top of this understanding.
2. What Volume EPO does
Volume EPO focuses on four essential volume parameters for each bar:
- Buy volume - Sell volume - Total volume - Delta volume (the difference between buy and sell volume)
The script presents these parameters in a compact heads up display (HUD) table that can be positioned anywhere on the chart. It is designed to be visually minimal, language aware, and usable on top of any other indicator or price action without cluttering the view.
The indicator does not output signals, alerts, arrows, or strategy entries. It is a descriptive and educational tool that shows how volume is distributed, not a prescriptive tool that tells the trader what to do.
3. Two definitions of volume
A central theme of this script is that there is more than one way to define and interpret “volume” inside a single candle. Volume EPO implements and clearly separates two different approaches:
- A geometric, candle based approximation that uses only OHLC and volume of the current bar. - An intrabar, data driven definition that uses lower timeframe up and down volume when it is available.
The user can switch between these modes via the calculation method input. The mode is prominently shown inside the on chart table so that the context is always explicit.
3.1 Geometry mode (Source File, approximate)
In Geometry mode, Volume EPO works only with the current bar’s OHLC values and total volume. No lower timeframe data is required.
The candle’s range is defined as high minus low. If the range is positive, the position of the close inside that range is used as a simple model for how volume might have been distributed between buyers and sellers:
- The closer the close is to the high, the more of the total volume is attributed to the buying side. - The closer the close is to the low, the more of the total volume is attributed to the selling side. - In a rare case where the bar has no price range (for example a flat or doji bar), total volume is split evenly between buy and sell volume.
From this model, the script derives:
- Buy volume (approximated) - Sell volume (approximated) - Total volume (as reported by the bar) - Delta volume as the difference between buy and sell volume
This approach is intentionally labeled as “Geometry (Approx)” in the HUD. It is a theoretical reconstruction based solely on the candle’s geometry and total volume, and it is always available on any market or timeframe that provides OHLCV data.
3.2 Intrabar mode (Precise)
In Intrabar mode, Volume EPO uses the TradingView built in library for up and down volume on a user selected lower timeframe. Instead of inferring volume from the shape of the candle, it reads the underlying lower timeframe data when that data is accessible.
The script requests up and down volume from a lower timeframe such as 15 seconds, using the official TA library functions. The results are then interpreted as follows:
- Buy volume is taken as the absolute value of the up volume. - Sell volume is taken as the absolute value of the down volume. - Total volume is the sum of buy and sell volume. - Delta volume is provided directly by the library as the difference between up and down volume.
If valid lower timeframe data exists for a bar, the bar is counted as covered by Intrabar data. If not, that bar is marked as invalid for this precise calculation and is excluded from the covered count.
This mode is labeled “Precise” in the HUD, together with the selected lower timeframe, because it is anchored in actual intrabar data rather than in a geometric model. It provides a closer view of how buying and selling pressure unfolded inside the bar, at the cost of requiring more data and being dependent on the availability of that data.
4. Coverage, lookback, and what the numbers mean
The top part of the HUD reports not only which volume definition is active, but also an additional line that describes the effective coverage of the data.
In Intrabar (Precise) mode, the script displays:
- “Scanned: N Bars”
Here, N counts how many bars since the indicator was loaded have successfully received valid lower timeframe delta data. It is a measure of how much of the visible history has been truly covered by intrabar information, not a lookback window in the sense of a rolling calculation.
In Geometry mode, the script displays:
- “Lookback: L Bars”
In this extracted layer, the lookback value L is purely descriptive. It does not change how the current bar’s volume is computed, and it is not used in any iterative or statistical calculation inside this script. It is meant as a conceptual label, for example to keep the volume layer consistent with a broader framework where lookback length is a structural parameter.
Summarizing these two fields:
- Scanned tells you how many bars have been processed using real intrabar data. - Lookback is a descriptive parameter in Geometry mode in this specific overlay, not a direct driver of the computations.
5. The HUD layout on the chart
The on chart table is intentionally compact and structured to be read quickly:
- Header: a title identifying the overlay as Volume EPO. - Mode line: explicitly states whether the script is in Precise or Geometry mode, and for Precise mode also shows the lower timeframe used. - Coverage line: - In Precise mode, it shows “Scanned: N Bars”. - In Geometry mode, it shows “Lookback: L Bars”. - Volume block: - A line for buy and sell volume, marked with clear directional symbols. - A line for total volume and the absolute delta, accompanied by the sign of the delta. - Numeric formatting uses human friendly suffixes (for example K, M, B) to keep the display readable. - Footer: the current symbol and a time stamp, adjusted by a user selectable timezone offset so that the HUD can be aligned with the trader’s local time reference.
The table can be positioned anywhere on the chart and resized via inputs, and it supports multiple color themes and languages in order to integrate cleanly into different chart layouts.
6. How to use Volume EPO in practice
Volume EPO is meant to be read together with price action and other tools, not in isolation. Typical uses include:
- Studying how often a strong directional candle is actually supported by dominant buy or sell volume. - Comparing the behavior of delta volume between Geometry and Intrabar definitions. - Building a personal intuition for how intrabar data refines or contradicts the simple candle based approximation. - Feeding these insights into separate, lean strategy scripts that do not need to carry the full explanatory logic of volume inside them.
Because it is an overlay layer, Volume EPO can be stacked with other custom indicators without adding new signals or complexity to their logic. It simply adds a clear and consistent view of volume behavior on top of whatever the trader is already watching.
7. Educational and non signalling nature
Finally, it is important to stress that Volume EPO is not a trading system, not a signal generator, and not financial advice. The script does not tell the user when to enter or exit. It only reports how different definitions of volume describe the current bar.
Deciding whether to trade, how to trade, and which risk parameters to use remains entirely with the user and with their own strategy. Volume EPO provides context and clarity around the concept of volume so that those decisions can be informed by a better understanding of how buying and selling pressure is structured inside each candle.
Note: Even on lower timeframes, every reconstruction of volume remains an approximation, except at the true single tick level. However, the closer the chosen lower timeframe is to a one tick stream, the more accurately it can reflect the underlying order flow and balance between buying and selling pressure.
LibVPrfLibrary "LibVPrf"
This library provides an object-oriented framework for volume
profile analysis in Pine Script®. It is built around the `VProf`
User-Defined Type (UDT), which encapsulates all data, settings,
and statistical metrics for a single profile, enabling stateful
analysis with on-demand calculations.
Key Features:
1. **Object-Oriented Design (UDT):** The library is built around
the `VProf` UDT. This object encapsulates all profile data
and provides methods for its full lifecycle management,
including creation, cloning, clearing, and merging of profiles.
2. **Volume Allocation (`AllotMode`):** Offers two methods for
allocating a bar's volume:
- **Classic:** Assigns the entire bar's volume to the close
price bucket.
- **PDF:** Distributes volume across the bar's range using a
statistical price distribution model from the `LibBrSt` library.
3. **Buy/Sell Volume Splitting (`SplitMode`):** Provides methods
for classifying volume into buying and selling pressure:
- **Classic:** Classifies volume based on the bar's color (Close vs. Open).
- **Dynamic:** A specific model that analyzes candle structure
(body vs. wicks) and a short-term trend factor to
estimate the buy/sell share at each price level.
4. **Statistical Analysis (On-Demand):** Offers a suite of
statistical metrics calculated using a "Lazy Evaluation"
pattern (computed only when requested via `get...` methods):
- **Central Tendency:** Point of Control (POC), VWAP, and Median.
- **Dispersion:** Value Area (VA) and Population Standard Deviation.
- **Shape:** Skewness and Excess Kurtosis.
- **Delta:** Cumulative Volume Delta, including its
historical high/low watermarks.
5. **Structural Analysis:** Includes a parameter-free method
(`getSegments`) to decompose a profile into its fundamental
unimodal segments, allowing for modality detection (e.g.,
identifying bimodal profiles).
6. **Dynamic Profile Management:**
- **Auto-Fitting:** Profiles set to `dynamic = true` will
automatically expand their price range to fit new data.
- **Manipulation:** The resolution, price range, and Value Area
of a dynamic profile can be changed at any time. This
triggers a resampling process that uses a **linear
interpolation model** to re-bucket existing volume.
- **Assumption:** Non-dynamic profiles are fixed and will throw
a `runtime.error` if `addBar` is called with data
outside their initial range.
7. **Bucket-Level Access:** Provides getter methods for direct
iteration and analysis of the raw buy/sell volume and price
boundaries of each individual price bucket.
---
**DISCLAIMER**
This library is provided "AS IS" and for informational and
educational purposes only. It does not constitute financial,
investment, or trading advice.
The author assumes no liability for any errors, inaccuracies,
or omissions in the code. Using this library to build
trading indicators or strategies is entirely at your own risk.
As a developer using this library, you are solely responsible
for the rigorous testing, validation, and performance of any
scripts you create based on these functions. The author shall
not be held liable for any financial losses incurred directly
or indirectly from the use of this library or any scripts
derived from it.
create(buckets, rangeUp, rangeLo, dynamic, valueArea, allot, estimator, cdfSteps, split, trendLen)
Construct a new `VProf` object with fixed bucket count & range.
Parameters:
buckets (int) : series int number of price buckets ≥ 1
rangeUp (float) : series float upper price bound (absolute)
rangeLo (float) : series float lower price bound (absolute)
dynamic (bool) : series bool Flag for dynamic adaption of profile ranges
valueArea (int) : series int Percentage of total volume to include in the Value Area (1..100)
allot (series AllotMode) : series AllotMode Allocation mode `classic` or `pdf` (default `classic`)
estimator (series PriceEst enum from AustrianTradingMachine/LibBrSt/1) : series LibBrSt.PriceEst PDF model when `model == PDF`. (deflault = 'uniform')
cdfSteps (int) : series int even #sub-intervals for Simpson rule (default 20)
split (series SplitMode) : series SplitMode Buy/Sell determination (default `classic`)
trendLen (int) : series int Look‑back bars for trend factor (default 3)
Returns: VProf freshly initialised profile
method clone(self)
Create a deep copy of the volume profile.
Namespace types: VProf
Parameters:
self (VProf) : VProf Profile object to copy
Returns: VProf A new, independent copy of the profile
method clear(self)
Reset all bucket tallies while keeping configuration intact.
Namespace types: VProf
Parameters:
self (VProf) : VProf profile object
Returns: VProf cleared profile (chaining)
method merge(self, srcABuy, srcASell, srcRangeUp, srcRangeLo, srcCvd, srcCvdHi, srcCvdLo)
Merges volume data from a source profile into the current profile.
If resizing is needed, it performs a high-fidelity re-bucketing of existing
volume using a linear interpolation model inferred from neighboring buckets,
preventing aliasing artifacts and ensuring accurate volume preservation.
Namespace types: VProf
Parameters:
self (VProf) : VProf The target profile object to merge into.
srcABuy (array) : array The source profile's buy volume bucket array.
srcASell (array) : array The source profile's sell volume bucket array.
srcRangeUp (float) : series float The upper price bound of the source profile.
srcRangeLo (float) : series float The lower price bound of the source profile.
srcCvd (float) : series float The final Cumulative Volume Delta (CVD) value of the source profile.
srcCvdHi (float) : series float The historical high-water mark of the CVD from the source profile.
srcCvdLo (float) : series float The historical low-water mark of the CVD from the source profile.
Returns: VProf `self` (chaining), now containing the merged data.
method addBar(self, offset)
Add current bar’s volume to the profile (call once per realtime bar).
classic mode: allocates all volume to the close bucket and classifies
by `close >= open`. PDF mode: distributes volume across buckets by the
estimator’s CDF mass. For `split = dynamic`, the buy/sell share per
price is computed via context-driven piecewise s(u).
Namespace types: VProf
Parameters:
self (VProf) : VProf Profile object
offset (int) : series int To offset the calculated bar
Returns: VProf `self` (method chaining)
method setBuckets(self, buckets)
Sets the number of buckets for the volume profile.
Behavior depends on the `isDynamic` flag.
- If `dynamic = true`: Works on filled profiles by re-bucketing to a new resolution.
- If `dynamic = false`: Only works on empty profiles to prevent accidental changes.
Namespace types: VProf
Parameters:
self (VProf) : VProf Profile object
buckets (int) : series int The new number of buckets
Returns: VProf `self` (chaining)
method setRanges(self, rangeUp, rangeLo)
Sets the price range for the volume profile.
Behavior depends on the `dynamic` flag.
- If `dynamic = true`: Works on filled profiles by re-bucketing existing volume.
- If `dynamic = false`: Only works on empty profiles to prevent accidental changes.
Namespace types: VProf
Parameters:
self (VProf) : VProf Profile object
rangeUp (float) : series float The new upper price bound
rangeLo (float) : series float The new lower price bound
Returns: VProf `self` (chaining)
method setValueArea(self, valueArea)
Set the percentage of volume for the Value Area. If the value
changes, the profile is finalized again.
Namespace types: VProf
Parameters:
self (VProf) : VProf Profile object
valueArea (int) : series int The new Value Area percentage (0..100)
Returns: VProf `self` (chaining)
method getBktBuyVol(self, idx)
Get Buy volume of a bucket.
Namespace types: VProf
Parameters:
self (VProf) : VProf Profile object
idx (int) : series int Bucket index
Returns: series float Buy volume ≥ 0
method getBktSellVol(self, idx)
Get Sell volume of a bucket.
Namespace types: VProf
Parameters:
self (VProf) : VProf Profile object
idx (int) : series int Bucket index
Returns: series float Sell volume ≥ 0
method getBktBnds(self, idx)
Get Bounds of a bucket.
Namespace types: VProf
Parameters:
self (VProf) : VProf Profile object
idx (int) : series int Bucket index
Returns:
up series float The upper price bound of the bucket.
lo series float The lower price bound of the bucket.
method getPoc(self)
Get POC information.
Namespace types: VProf
Parameters:
self (VProf) : VProf Profile object
Returns:
pocIndex series int The index of the Point of Control (POC) bucket.
pocPrice. series float The mid-price of the Point of Control (POC) bucket.
method getVA(self)
Get Value Area (VA) information.
Namespace types: VProf
Parameters:
self (VProf) : VProf Profile object
Returns:
vaUpIndex series int The index of the upper bound bucket of the Value Area.
vaUpPrice series float The upper price bound of the Value Area.
vaLoIndex series int The index of the lower bound bucket of the Value Area.
vaLoPrice series float The lower price bound of the Value Area.
method getMedian(self)
Get the profile's median price and its bucket index. Calculates the value on-demand if stale.
Namespace types: VProf
Parameters:
self (VProf) : VProf Profile object.
Returns:
medianIndex series int The index of the bucket containing the Median.
medianPrice series float The Median price of the profile.
method getVwap(self)
Get the profile's VWAP and its bucket index. Calculates the value on-demand if stale.
Namespace types: VProf
Parameters:
self (VProf) : VProf Profile object.
Returns:
vwapIndex series int The index of the bucket containing the VWAP.
vwapPrice series float The Volume Weighted Average Price of the profile.
method getStdDev(self)
Get the profile's volume-weighted standard deviation. Calculates the value on-demand if stale.
Namespace types: VProf
Parameters:
self (VProf) : VProf Profile object.
Returns: series float The Standard deviation of the profile.
method getSkewness(self)
Get the profile's skewness. Calculates the value on-demand if stale.
Namespace types: VProf
Parameters:
self (VProf) : VProf Profile object.
Returns: series float The Skewness of the profile.
method getKurtosis(self)
Get the profile's excess kurtosis. Calculates the value on-demand if stale.
Namespace types: VProf
Parameters:
self (VProf) : VProf Profile object.
Returns: series float The Kurtosis of the profile.
method getSegments(self)
Get the profile's fundamental unimodal segments. Calculates on-demand if stale.
Uses a parameter-free, pivot-based recursive algorithm.
Namespace types: VProf
Parameters:
self (VProf) : VProf The profile object.
Returns: matrix A 2-column matrix where each row is an pair.
method getCvd(self)
Cumulative Volume Delta (CVD) like metric over all buckets.
Namespace types: VProf
Parameters:
self (VProf) : VProf Profile object.
Returns:
cvd series float The final Cumulative Volume Delta (Total Buy Vol - Total Sell Vol).
cvdHi series float The running high-water mark of the CVD as volume was added.
cvdLo series float The running low-water mark of the CVD as volume was added.
VProf
VProf Bucketed Buy/Sell volume profile plus meta information.
Fields:
buckets (series int) : int Number of price buckets (granularity ≥1)
rangeUp (series float) : float Upper price range (absolute)
rangeLo (series float) : float Lower price range (absolute)
dynamic (series bool) : bool Flag for dynamic adaption of profile ranges
valueArea (series int) : int Percentage of total volume to include in the Value Area (1..100)
allot (series AllotMode) : AllotMode Allocation mode `classic` or `pdf`
estimator (series PriceEst enum from AustrianTradingMachine/LibBrSt/1) : LibBrSt.PriceEst Price density model when `model == PDF`
cdfSteps (series int) : int Simpson integration resolution (even ≥2)
split (series SplitMode) : SplitMode Buy/Sell split strategy per bar
trendLen (series int) : int Look‑back length for trend factor (≥1)
maxBkt (series int) : int User-defined number of buckets (unclamped)
aBuy (array) : array Buy volume per bucket
aSell (array) : array Sell volume per bucket
cvd (series float) : float Final Cumulative Volume Delta (Total Buy Vol - Total Sell Vol).
cvdHi (series float) : float Running high-water mark of the CVD as volume was added.
cvdLo (series float) : float Running low-water mark of the CVD as volume was added.
poc (series int) : int Index of max‑volume bucket (POC). Is `na` until calculated.
vaUp (series int) : int Index of upper Value‑Area bound. Is `na` until calculated.
vaLo (series int) : int Index of lower value‑Area bound. Is `na` until calculated.
median (series float) : float Median price of the volume distribution. Is `na` until calculated.
vwap (series float) : float Profile VWAP (Volume Weighted Average Price). Is `na` until calculated.
stdDev (series float) : float Standard Deviation of volume around the VWAP. Is `na` until calculated.
skewness (series float) : float Skewness of the volume distribution. Is `na` until calculated.
kurtosis (series float) : float Excess Kurtosis of the volume distribution. Is `na` until calculated.
segments (matrix) : matrix A 2-column matrix where each row is an pair. Is `na` until calculated.

LibVolmLibrary "LibVolm"
This library provides a collection of core functions for volume and
money flow analysis. It offers implementations of several classic
volume-based indicators, with a focus on flexibility
for applications like multi-timeframe and session-based analysis.
Key Features:
1. **Suite of Classic Volume Indicators:** Includes standard
implementations of several foundational indicators:
- **On Balance Volume (`obv`):** A momentum indicator that
accumulates volume based on price direction.
- **Accumulation/Distribution Line (`adLine`):** Measures cumulative
money flow using the close's position within the bar's range.
- **Chaikin Money Flow (`cmf`):** An oscillator version of the ADL
that measures money flow over a specified lookback period.
2. **Anchored/Resettable Indicators:** The library includes flexible,
resettable indicators ideal for cyclical analysis:
- **Anchored VWAP (`vwap`):** Calculates a Volume Weighted Average
Price that can be reset on any user-defined `reset` condition.
It returns both the VWAP and the number of bars (`prdBars`) in
the current period.
- **Resettable CVD (`cvd`):** Computes a Cumulative Volume Delta
that can be reset on a custom `reset` anchor. The function
also tracks and returns the highest (`hi`) and lowest (`lo`)
delta values reached within the current period.
(Note: The delta sign is determined by a specific logic:
it first checks close vs. open, then close vs. prior
close, and persists the last non-zero sign).
3. **Volume Sanitization:** All functions that use the built-in
`volume` variable automatically sanitize it via an internal
function. This process replaces `na` values with 0 and ensures
no negative volume values are used, providing stable calculations.
---
**DISCLAIMER**
This library is provided "AS IS" and for informational and
educational purposes only. It does not constitute financial,
investment, or trading advice.
The author assumes no liability for any errors, inaccuracies,
or omissions in the code. Using this library to build
trading indicators or strategies is entirely at your own risk.
As a developer using this library, you are solely responsible
for the rigorous testing, validation, and performance of any
scripts you create based on these functions. The author shall
not be held liable for any financial losses incurred directly
or indirectly from the use of this library or any scripts
derived from it.
obv(price)
Calculates the On Balance Volume (OBV) cumulative indicator.
Parameters:
price (float) : series float Source price series, typically the close.
Returns: series float Cumulative OBV value.
adLine()
Computes the Accumulation/Distribution Line (AD Line).
Returns: series float Cumulative AD Line value.
cmf(length)
Computes Chaikin Money Flow (CMF).
Parameters:
length (int) : series int Lookback length for the CMF calculation.
Returns: series float CMF value.
vwap(price, reset)
Calculates an anchored Volume Weighted Average Price (VWAP).
Parameters:
price (float) : series float Source price series (usually *close*).
reset (bool) : series bool A signal that is *true* on the bar where the
accumulation should be reset.
Returns:
vwap series float The calculated Volume Weighted Average Price for the current period.
prdBars series int The number of bars that have passed since the last reset.
cvd(reset)
Calculates a resettable, cumulative Volume Delta (CVD).
It accumulates volume delta and tracks its high/low range. The
accumulation is reset to zero whenever the `reset` condition is true.
This is useful for session-based analysis, intra-bar calculations,
or any other custom-anchored accumulation.
Parameters:
reset (bool) : series bool A signal that is *true* on the bar where the
accumulation should be reset.
Returns:
cum series float The current cumulative volume delta.
hi series float The highest peak the cumulative delta has reached in the current period.
lo series float The lowest trough the cumulative delta has reached in the current period.

Net Positions (Net Longs & Net Shorts) - Volume AdjustedNet Positions (Net Longs & Net Shorts) - Volume Adjusted
Based on the legendary LeviathanCapital - Net Positions Indicator
Adjusted to use volume calculation for more percise data
Few important caveats:
- EVERY BUYER NEED A SELLER AND EVERY SELLER NEED A BUYER
- This indicator is meant to give you a sense of direction for the market orders ("who is the aggresive side") and should be used as confluence not as true values
In reality, in market movement each candle will contain both buying and selling, contracts closing and opening but due to some limitations that is hard to make properly.
Even with these limitations this indicator can provide a better picture than some other even external tools out there.
The main benefit of using volume delta and open interest instead of just open interest and candle closes G/R that it solves the problem with extreme cases where there might be an absorption of market orders.
Example of the Volume Edge in Action:
Bullish Absorption (The "Trap" for Sellers)
Candle Close + OI: A large Red Candle forms with Rising OI. The interpretation is simply: "New shorts are opening"
Volume Delta + OI: The same Red Candle with Rising OI has a Positive Volume Delta.
The True Story: Aggressive buyers tried to push the price up, but they were completely absorbed by large passive sell orders.
The "Volume Delta" logic:
If OI ↑ → new positions opened
• Delta ↑ → net longs added
• Delta ↓ → net shorts added
If OI ↓ → positions closed
• Delta ↑ → shorts closing
• Delta ↓ → longs closing
The "Price" logic:
If OI ↑ → new positions opened
• Price ↑ → net longs added
• Price ↓ → net shorts added
If OI ↓ → positions closed
• Price ↑ → shorts closing
• Price ↓ → longs closing

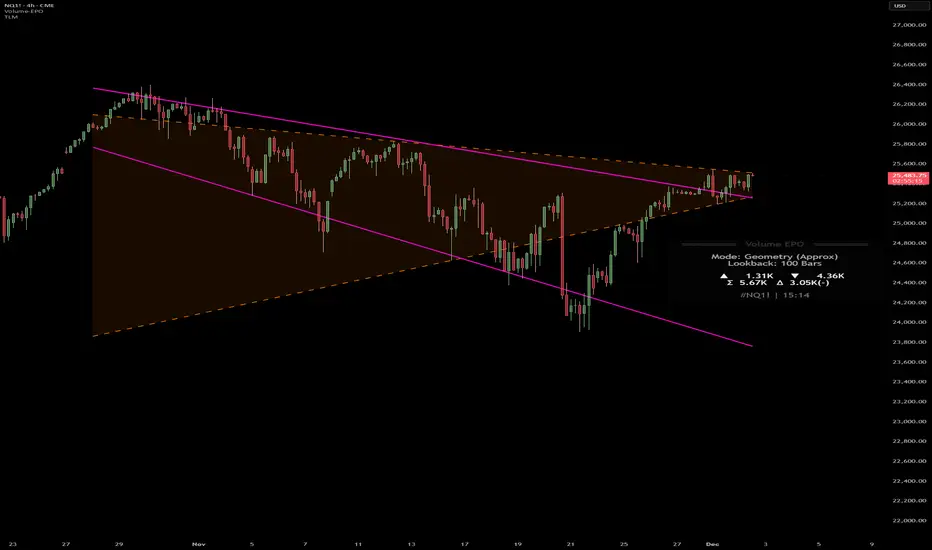
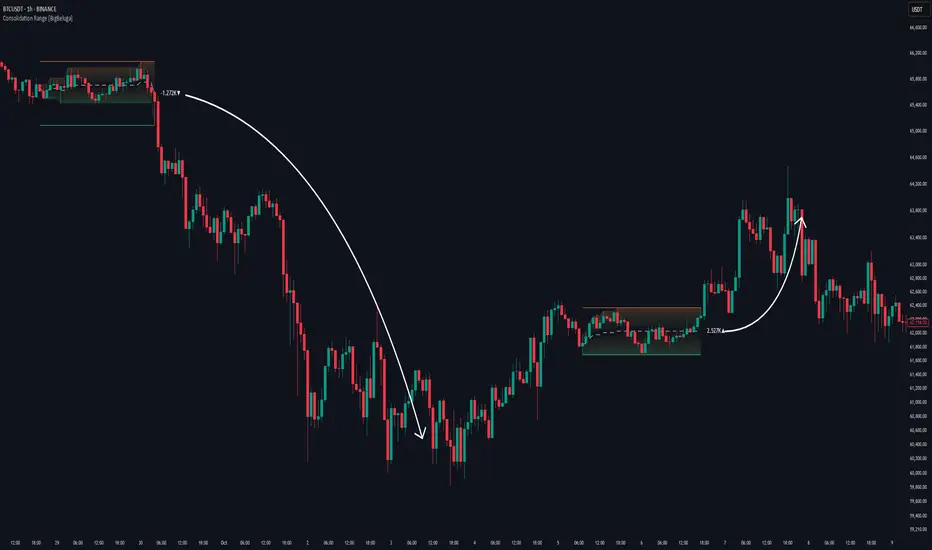
Consolidation Range [BigBeluga]A hybrid volatility-volume indicator that isolates periods of price equilibrium and reveals the directional force behind each range buildup.
Consolidation Range is a powerful tool designed to detect compression phases in the market using volatility thresholds while visualizing volume imbalance within those phases. By combining low-volatility detection with directional volume delta, it highlights where accumulation or distribution is occurring—giving traders the confidence to act when breakouts follow. This indicator is particularly valuable in choppy or sideways markets where range identification and sentiment context are key.
🔵 CONCEPTS
Volatility Compression: Uses ADX (Average Directional Index) to detect periods of low trend strength—specifically when ADX drops below a configurable threshold.
Range Structure: Upon a low-volatility trigger, the script dynamically anchors horizontal upper and lower bounds based on local highs and lows.
Directional Volume Delta: Inside each active range, it calculates the net difference between buy and sell volume, showing who controlled the range.
Sentiment Bias: A label appears in the center of the zone on breakout, showing the accumulated delta and bias direction (▲ for positive, ▼ for negative).
Range Validity Filter: Only ranges with more than 15 bars are considered valid—short-lived consolidations are auto-filtered.
🔵 KEY FEATURES
Detects low volatility market phases using ADX logic (crosses under "Volatility Threshold Input").
Automatically plots adaptive consolidation zones with upper and lower boundary lines.
Includes dynamic midline to visualize the price average inside the range.
Visual range is filled with a progressive gradient to reflect distance between highs and lows.
When the range is active, the indicator accumulates volume delta (Buy - Sell volume) .
Upon breakout, the total volume delta is displayed at the midpoint , providing insight into market sentiment during the consolidation phase.
Filters out weak or short-lived consolidations under 15 bars.
🔵 HOW TO USE
Spot ranging or compression zones with minimal effort.
Use breakouts with volume delta bias to assess the strength or weakness of moves.
Combine with trend-following tools or volume-based confirmation for stronger setups.
Apply to higher timeframes for macro consolidation tracking .
🔵 CONCLUSION
Consolidation Range now brings together volatility filtering and directional volume delta into one smart module. This hybrid logic allows traders to not only identify balance zones but also understand who was in control during the buildup—offering a sharper edge for breakout and trend continuation strategies.
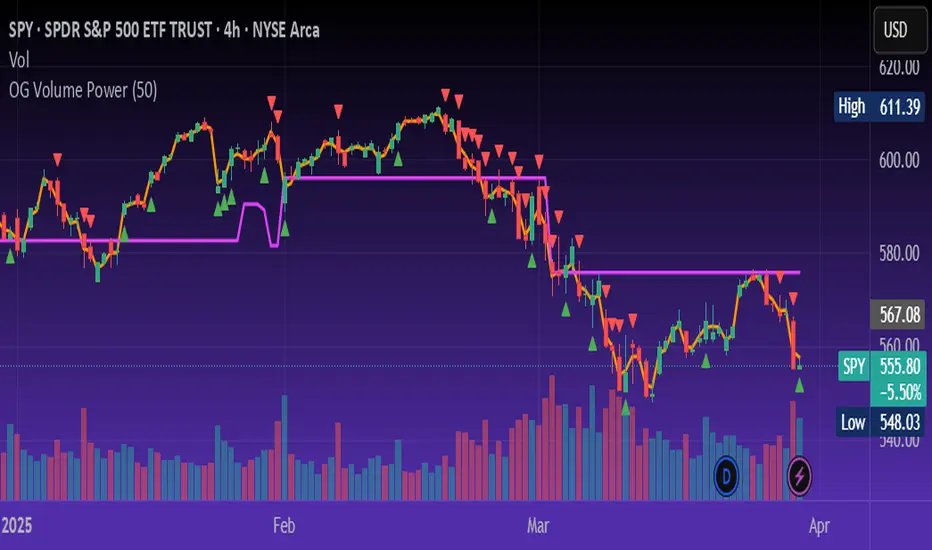
OG Volume PowerDescription:
The OG Volume Power is an elite-level volume analysis suite built for identifying momentum surges, trend continuation, and buyer/seller imbalances at critical price levels. It combines real-time VWAP tracking, a dynamic Point of Control (POC), and volume delta clusters to give traders a complete picture of price and volume interaction.
🔍 Key Features:
Real-Time VWAP:
Tracks volume-weighted average price to identify mean reversion and intraday fair value zones. Ideal for institutional-level entries and exits.
Dynamic POC (Point of Control):
Automatically finds the price level with the highest volume over the last N candles (default 50), helping traders pinpoint where market participants are most committed.
Buyer/Seller Volume Delta Clusters:
Highlights imbalances between buying and selling pressure using bullish and bearish volume deltas that exceed the 20-bar volume average — excellent for momentum detection and early trend recognition.
⚙️ How It Works:
Green triangle: Buyer surge (bullish delta + above average volume)
Red triangle: Seller surge (bearish delta + above average volume)
Magenta line: Dynamic POC (highest volume price over recent candles)
Orange line: VWAP (acts as a magnetic force for price)
📈 Best For:
Intraday scalping or swing trading on SPY, QQQ, BTC, or Forex
Volume flow confirmation before breakout entries
Filtering false breakouts with delta strength signals
🧠 Pro Tip:
Use OG Volume Power alongside your trend indicators (like OG EMA Stack or OG Supertrend) to confirm that volume is backing the move. Look for surges near VWAP or POC zones for sniper-level entries.
Adaptive Trend Finder - Pulse Frequency(Basic)The Adaptive Pulse Frequency & Amplitude Trend Indicator is a Pine Script-based tool designed for lower timeframe volume analysis and trend detection. By analyzing volume dynamics and identifying significant "pulses" in market activity, this indicator provides insights into bullish and bearish trends. Here's an overview of its key features and components:
1. Lower Timeframe Volume Analysis
Custom Timeframe Input: The indicator scans lower timeframe data to approximate Up/Down volume, with an optional override to set a custom timeframe.
Volume Delta Calculation: Tracks changes in volume (deltaVolume), representing the difference between up and down volume for each bar.
2. Adaptive Pulse Detection
Rolling Percentile Threshold: Dynamically calculates a threshold based on the pulsePercentile of the absolute delta volume within a specified lookback period (pulseLookback).
Pulse Identification: Bars where the absolute delta volume exceeds the adaptive threshold are classified as "pulses," indicating significant market activity.
Bullish Pulse: Positive delta volume exceeding the threshold.
Bearish Pulse: Negative delta volume exceeding the threshold.
3. Frequency & Amplitude Analysis
Pulse Frequency: Measures the number of bullish or bearish pulses within a rolling window (freqLookback), providing insights into the activity level.
Pulse Amplitude: Computes the cumulative volume delta for bullish and bearish pulses over a defined period (ampLookback), offering a finer view of market strength:
Bullish Amplitude: Sum of positive delta volume for bullish pulses.
Bearish Amplitude: Sum of absolute delta volume for bearish pulses.
4. Trend Logic
Trend Classification:
Bullish Trend: Higher bullish pulse frequency and amplitude.
Bearish Trend: Higher bearish pulse frequency and amplitude.
Neutral Trend: Mixed or inconclusive signals.
Advanced Metrics: Combines frequency and amplitude for robust trend assessment.
5. Visualization
Dynamic Threshold: Plots the adaptive threshold for real-time pulse detection.
Trend Visualization: Colors the chart background based on the identified trend (Bullish, Bearish, Neutral).
Amplitude and Frequency Lines: Displays separate plots for:
Net Frequency (Bullish - Bearish pulses).
Net Amplitude (Bullish amplitude - Bearish amplitude).
Individual bullish and bearish amplitudes for reference.
Use Case
This indicator is ideal for traders seeking to:
Analyze market activity on lower timeframes.
Identify shifts in bullish/bearish momentum through volume dynamics.
Enhance trend-following strategies with adaptive frequency and amplitude metrics.
With its focus on precision and adaptability, the Adaptive Pulse Frequency & Amplitude Trend Indicator is a powerful tool for volume-based market analysis.

Zig-Zag Volume Profile (Bull vs. Bear) [Kioseff Trading]Hello!
Thank you @Pinecoders and @TradingView for putting polylines in production and making this viable!!
This script "Zig Zag Volume Profile" implements the polyline feature for Pine Script!
Features
Volume Profile anchored to zig zag trends
Bull vs Bear profiles!
Delta x price level
Standard POC and value area lines, in addition to separated POCs and value area lines for bull profiles and bear profiles
Up to 9999 profile rows per zigzag trend
Stylistic options for profiles
Configurable zig zag - profiles generated for small to large trends
Polylines!
This script generates Bull vs. Bear volume profiles for zig zag trends!
The zigzag indicator is configurable as normal; minor and major trend volume profiles are calculable. This indicator can be thought of as "Volume Profile/Delta for Trends''.
Up to 9999 volume profile levels (price levels) can be calculated for each profile, thanks to the new polyline feature, allowing for less aggregation / more precision of volume at price and volume delta.
Zig Zag Bull Vs Bear Profiles
The image above shows primary functionality!
Green profiles = buying volume
Red profiles = selling volume
Profiles are generated for each trend identified by the zigzag indicator.
The image above shows the indicator calculating volume delta for specific price blocks on the profile. Aggregate volume delta for the identified trend is displayed over the profile!
The image above shows Bull Profile POC lines and value area lines. Bear Profile POC lines and value area lines are also shown!
All colors and transparencies are configurable to the user's liking :D
Additionally, you can select to have the profiles drawn on contrasting sides. Bull Profile on left and Bear Profile on right.
For a more traditional look - you can select to draw the Bull & Bear profiles on the same x-point.
The indicator is robust enough to calculate on "long zig zags" and "short zig zags"; curved profiles can also be used!
The image above exemplifies usage of the indicator!
Bull & Bear volume profiles are calculated for trends on the 30-second timeframe.
The image above shows a more "utilitarian" presentation of the profiles. Once more, line and linefill colors/transparencies are all customizable; the indicator can look however you would like it to!
The image above shows key levels, the Bull vs. Bear profile, and volume delta for the current trend!
That's about it :D
This indicator is part of a series titled "Bull vs. Bear" - a suite of profile-like indicators I will be releasing over coming days. Thanks for checking this out!
Of course, a big thank you to @RicardoSantos for his MathOperator library that I use in every script.
If you have any suggestions please feel free to share!

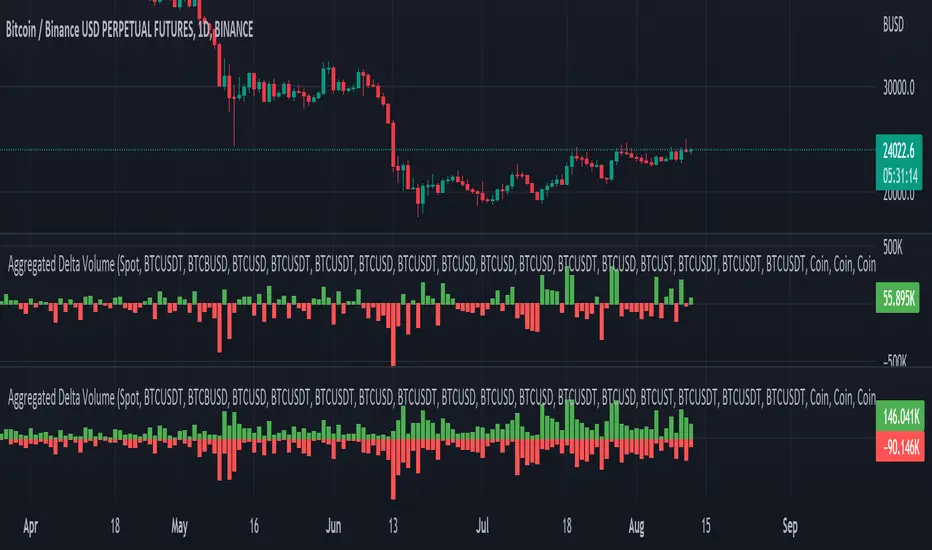
Aggr. CDV / Delta Volume - InFinitoModified & Updated script from MARKET VOLUME by Ricardo M Arjona @XeL_Arjona that Includes Aggregated Volume, Delta Volume, Volume by Side
Aggregation code originally from Crypt0rus
Candle Plotting code from LonesomeTheBlue
***The indicator can be used for any coin/symbol to aggregate volume , but it has to be set up manually***
***The indicator can be used with specific symbol data only by disabling the aggregation option, which allows for it to be used on any symbol***
- Calculated based on Aggregated Volume instead of by symbol volume . Using aggregated data makes it more accurate and allows to compare volume flow between different kinds of markets (Spot, Futures , Perpetuals, Futures+Perpetuals and All Volume ).
- As well, in order to make the data as accurate as possible, the data from each exchange aggregated is normalized to report always in terms of 1 BTC . In case this indicator is used for another symbol, the calculations can be adjusted manually to make it always report data in terms of 1 contract/coin.
All Aggregated Volume By Side: Based of Xel_Arjona's calculation, buy and sell volume is estimated each period. This indicators can display both Buy Volume and Sell Volume for each period.
Aggregated Delta Volume By Side: Displays the difference between Buy & Sell Volume as Delta (Down if Sell Vol - Up if Buy Vol)
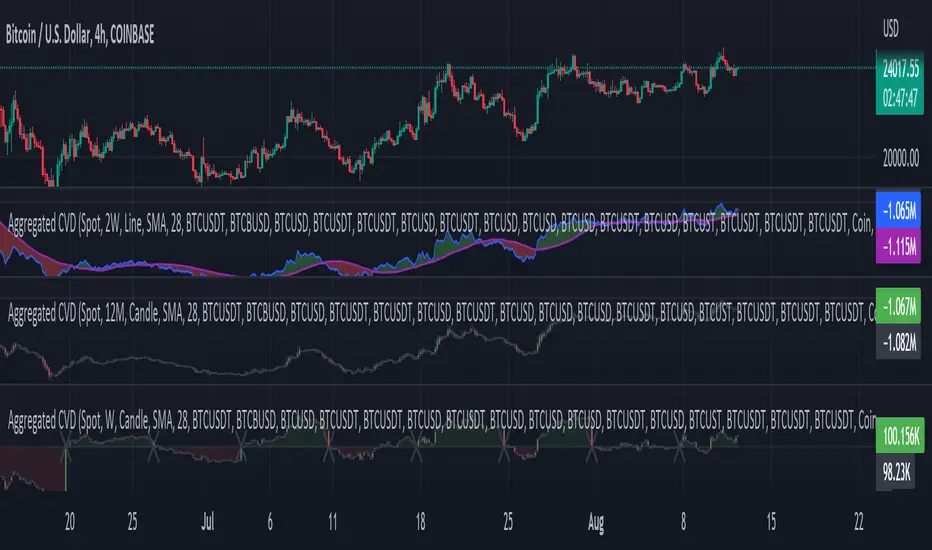
Aggregated Cumulative Delta Volume: Displays the sum of Delta Volume as a line, candles or Heiken Aishi Candles. Great for observing Volume Flow and spotting divergences
- It is Possible to add an MA to the CVD and to color fill in between the indicator and the MA
- It is possible to reset the indicators basis to 0 periodically
Delta Money Flow IndexThe Delta Money Flow Index is a modified version of the traditional Money Flow Index that uses directional volume instead of total volume to measure buying and selling pressure in a different way.
It helps traders identify overbought/oversold conditions based on actual buy/sell pressure rather than just total volume. It's designed for traders who want to see if price movements are backed by genuine buying or selling activity.
How to use it:
- Values above 80 indicate overbought conditions
- Values below 20 indicate oversold conditions
- The 50 level acts as a neutral zone. Above suggests buyers are in control, below suggests sellers are in control.
- Traders can check for divergences for potential reversal signals
- Works best on intraday timeframes where delta volume is most meaningful
What makes it different:
Unlike the standard MFI which uses total volume, the Delta MFI calculates an approximation of volume delta by assigning positive volume to up-closing candles and negative volume to down-closing candles.
This means:
- It focuses on directional pressure, not just activity
- Filters out low-conviction volume that doesn't move price
- Provides clearer signals when actual buying/selling dominates
The indicator includes visual aids like background colors for overbought/oversold and a fill showing whether the Delta MFI is above or below the 50 midpoint for quick interpretation.

Smart Money Support/Resistance - LiteSmart Money Support/Resistance — Lite
Overview & Methodology
This indicator identifies support and resistance as zones derived from concentrated buying and selling pressure, rather than relying solely on traditional swing highs/lows. Its design focuses on transparency: how data is sourced, how zones are computed, and how the on‑chart display should be interpreted.
Lower‑Timeframe (LTF) Data
The script requests Up Volume, Down Volume, and Volume Delta from a lower timeframe to expose intrabar order‑flow structure that the chart’s native timeframe cannot show. In practical terms, this lets you see where buyers or sellers briefly dominated inside the body of a higher‑timeframe bar.
bool use_custom_tf_input = input.bool(true, title="Use custom lower timeframe", tooltip="Override the automatically chosen lower timeframe for volume calculations.", group=grpVolume)
string custom_tf_input = input. Timeframe("1", title="Lower timeframe", tooltip="Lower timeframe used for up/down volume calculations (default 5 seconds).", group=grpVolume)
import TradingView/ta/10 as tvta
resolve_lower_tf(useCustom, customTF) =>
useCustom ? customTF :
timeframe.isseconds ? "1S" :
timeframe.isintraday ? "1" :
timeframe.isdaily ? "5" : "60"
get_up_down_volume(lowerTf) =>
= tvta.requestUpAndDownVolume(lowerTf)
var float upVolume = na
var float downVolume = na
var float deltaVolume = na
string lower_tf = resolve_lower_tf(use_custom_tf_input, custom_tf_input)
= get_up_down_volume(lower_tf)
upVolume := u_tmp
downVolume := d_tmp
deltaVolume := dl_tmp
• Data source: TradingView’s ta.requestUpAndDownVolume(lowerTf) via the official TA library.
• Plan capabilities: higher‑tier subscriptions unlock seconds‑based charts and allow more historical bars per chart. This expands both the temporal depth of LTF data and the precision of short‑horizon analysis, while base tiers provide minute‑level data suitable for day/short‑swing studies.
• Coverage clarity: a small on‑chart Coverage Panel reports the active lower timeframe, the number of bars covered, and the latest computed support/resistance ranges so you always know the bounds of valid LTF input.
Core Method
1) Data acquisition (LTF)
The script retrieves three series from the chosen lower timeframe:
– Up Volume (buyers)
– Down Volume (sellers)
– Delta (Up – Down)
2) Rolling window & extrema
Over a user‑defined lookback (Global Volume Period), the algorithm builds rolling arrays of completed bars and scans for extrema:
– Buyers_max / Buyers_min from Up Volume
– Sellers_max / Sellers_min from Down Volume
Only completed bars are considered; the current bar is excluded for stability.
3) Price mapping
The extrema are mapped back to their source candles to obtain price bounds:
– For “maximum” roles the algorithm uses the relevant candle highs.
– For “minimum” roles it uses the relevant candle lows.
These pairs define candidate resistance (max‑based) and support (min‑based) zones or vice versa.
4) Zone construction & minimum width
To ensure practicality on all symbols, zones enforce a minimum vertical thickness of two ticks. This prevents visually invisible or overly thin ranges on instruments with tight ticks.
5) Vertical role resolution
When both max‑ and min‑based zones exist, the script compares their midpoints. If, due to local price structure, the min‑based zone sits above the max‑based zone, display roles are swapped so the higher zone is labeled Resistance and the lower zone Support. Colors/widths are updated accordingly to keep the visual legend consistent.
6) Rendering & panel
Two horizontal lines and a filled box represent each active zone. The Coverage Panel (bottom‑right by default) prints:
– Lower‑timeframe in use
– Number of bars covered by LTF data
– Current Support and Resistance ranges
If the two zones overlap, an additional “Range Market” note is shown.
Key Inputs
• Global Volume Period: shared lookback window for the extrema search.
• Lower timeframe: user‑selectable override of the automatically resolved lower timeframe.
• Visualization toggles: independent show/hide controls and colors for maximum (resistance) and minimum (support) zones.
• Coverage Panel: enable/disable the single‑cell table and its readout.
Operational Notes
• The algorithm aligns all lookups to completed bars (no peeking). Price references are shifted appropriately to avoid using the still‑forming bar in calculations.
• Second‑based lower timeframes improve granularity for scalping and very short‑term entries. Minute‑based lower timeframes provide broader coverage for intraday and short‑swing contexts.
• Use the Coverage Panel to confirm the true extent of available LTF history on your symbol/plan before drawing conclusions from very deep lookbacks.
Visual Walkthrough
A step‑by‑step image sequence accompanies this description. Each figure demonstrates how the indicator reads LTF volume, locates extrema, builds price‑mapped zones, and updates labels/colors when vertical order requires it.
Chart Interpretation
This chart illustrates two distinct perspectives of the Smart Money Support/Resistance — Lite indicator, each derived from different lookback horizons and lower-timeframe (LTF) resolutions.
1- Short-term view (43 bars, 10-second LTF)
Using the most recent 43 completed bars with 10-second intrabar data, the algorithm detects that both maximum and minimum volume extrema fall within a narrow range. The result is a clearly identified range market: resistance between 178.15–184.55 and support between 175.02–179.38.
The Coverage Panel (bottom-right) confirms the scope of valid input: the lower timeframe used, number of bars covered, and the resulting zones. This short-term scan highlights how the indicator adapts to limited data depth, flagging sideways structure where neither side dominates.
2 - Long-term view (120 bars, 30-second LTF)
Over a wider 120-bar lookback with higher-granularity 30-second data, broader supply and demand zones emerge.
– The long-term resistance zone captures the concentration of buyers and sellers at the upper boundary of recent price history.
– The long-term support zone anchors to the opposite side of the distribution, derived from maxima and minima of both buying and selling pressure.
These zones reflect deeper structural levels where market participants previously committed significant volume.
Combined Perspective
By aligning the short-term and long-term outputs, the chart shows how the indicator distinguishes immediate consolidation (range market) from more durable support and resistance levels derived from extended history. This dual resolution approach makes clear that support and resistance are not static lines but dynamic zones, dependent on both timeframe depth and the resolution of intrabar volume data.

Aggregated Delta (Buy/Sell) Volume - InFinito||||||||||||||||CREDITS||||||||||||||||
Modified & Updated script from MARKET VOLUME by Ricardo M Arjona @XeL_Arjona that Includes Aggregated Volume , Delta Volume , Volume by Side
Aggregation code originally from Crypt0rus
||||||||||||||||NOTES||||||||||||||||
- Calculated based on Aggregated Volume instead of by symbol volume . Using aggregated data makes it more accurate and allows to compare volume flow between different kinds of markets (Spot, Futures , Perpetuals, Futures+Perpetuals and All Volume ).
- As well, in order to make the data as accurate as possible, the data from each exchange aggregated is normalized to report always in terms of 1 BTC . In case this indicator is used for another symbol, the calculations can be adjusted manually to make it always report data in terms of 1 contract/coin.
- The indicator can be used for any coin/symbol to aggregate volume , but it has to be set up manually
- The indicator can be used with specific symbol data only by disabling the aggregation option, which allows for it to be used on any symbol
- Previously Included with "Aggr. CDV / Delta Volume" this functionality has been removed from the latter indicator for functionality and simplicity purposes.
||||||||||||||||FUNCTIONALITY||||||||||||||||
Aggregated Delta Volume: Based off Xel_Arjona's calculation, buy and sell volume is estimated each period. This indicators can display both Buy Volume and Sell Volume for each period.
By Default, this indicator displays Delta Volume by side, which is the difference between the estimated buy and sell volume.
By checking the Option "Show all volume by side", instead of the Delta volume, all Buy and Sell Volume will be displayed by side
Buy/Sell Aggregated Delta Pressure - InFinitoModified & Updated script from MARKET VOLUME by Ricardo M Arjona @XeL_Arjona that Includes Aggregated Volume , Delta Buy/Sell Pressure
Aggregation code originally from Crypt0rus
***The indicator can be used for any coin/symbol to aggregate volume , but it has to be set up manually***
***The indicator can be used with specific symbol data only by disabling the aggregation option, which allows for it to be used on any symbol***
- Calculated based on Aggregated Volume instead of by symbol volume . Using aggregated data makes it more accurate and allows to compare volume flow between different kinds of markets (Spot, Futures , Perpetuals, Futures+Perpetuals and All Volume ).
- As well, in order to make the data as accurate as possible, the data from each exchange aggregated is normalized to report always in terms of 1 BTC . In case this indicator is used for another symbol, the calculations can be adjusted manually to make it always report data in terms of 1 contract/coin.
- Buy/Sell Pressure: Smoothens the buy and sell volume into a signal for each. Which makes it easier to identify Buy and Sell Volume Flow.
- Buy/Sell Delta Pressure: Calculates the difference between Buy & Sell Pressure and plots a Delta signal that shows who is in control currently.
- Buy/Sell + Delta Pressure: Displays both Buy & Sell Pressure and Delta pressure. This can help to visualize who is in control but also how much pressure there is on each side.
- A Moving Average can be plotted to the Delta pressure. This, with confluence, can give great entries/exits
Things to look for:
- Divergences: If price keeps moving in one direction but the pressure to that side decreases it can be inferred that the move might slow down soon or revert. As well if pressure to one side increases but price does not react to it, it signals that the other side is stronger.
- MA/Zero Crossovers: Delta Pressure Crossover of its moving average or the 0 Line can indicate direction changes prematurely

Realtime 5D Profile [LucF]█ OVERVIEW
This indicator displays a realtime profile that can be configured to visualize five dimensions: volume, price, time, activity and age. For each price level in a bar or timeframe, you can display total or delta volume or ticks. The tick count measures activity on a level. The thickness of each level's line indicates its age, which helps you identify the most recent levels.
█ WARNING
The indicator only works in real time. Contrary to TradingView's line of volume profile indicators , it does not show anything on historical bars or closed markets, and it cannot display volume information if none exists for the data feed the chart is using. A realtime indicator such as this one only displays information accumulated while it is running on a chart. The information it calculates cannot be saved on charts, nor can it be recalculated from historical bars. If you refresh the chart, or the script must re-execute for some reason, as when you change inputs, the accumulated information will be lost.
Because "Realtime 5D Profile" requires time to accumulate information on the chart, it will be most useful to traders working on small timeframes who trade only one instrument and do not frequently change their chart's symbol or timeframe. Traders working on higher timeframes or constantly changing charts will be better served by TradingView's volume profiles. Before using this indicator, please see the "Limitations" section further down for other important information.
█ HOW TO USE IT
Load the indicator on an active chart (see here if you don't know how).
The default configuration displays:
• A double-sided volume profile showing at what price levels activity has occurred.
• The left side shows "down" volume, the right side shows "up" volume.
• The value corresponding to each level is displayed.
• The width of lines reflects their relative value.
• The thickness of lines reflects their age. Four thicknesses are used, with the thicker lines being the most recent.
• The total value of down/up values for the profile appears at the top.
To understand how to use profiles in your trading, please research the subject. Searches on "volume profile" or "market profile" will yield many useful results. I provide you with tools — I do not teach trading. To understand more about this indicator, read on. If you choose not to do so, please don't ask me to answer questions that are already answered here, nor to make videos; I don't.
█ CONCEPTS
Delta calculations
Volume is slotted in up or down slots depending on whether the price of each new chart update is higher or lower than the previous update's price. When price does not move between chart updates, the last known direction is used. In a perfect world, Pine scripts would have access to bid and ask levels, as this would allow us to know for sure if market orders are being filled on upticks (at the ask) or downticks (at the bid). Comparing the price of successive chart updates provides the most precise way to calculate volume delta on TradingView, but it is still a compromise. Order books are in constant movement; in some cases, order cancellations can cause sudden movements of both the bid and ask levels such that the next chart update can occur on an uptick at a lower price than the previous one (or vice versa). While this update's volume should be slotted in the up slot because a buy market order was filled, it will erroneously be slotted in the down slot because the price of the chart's update is lower than that of the previous one. Luckily, these conditions are relatively rare, so they should not adversely affect calculations.
Levels
A profile is a tool that displays information organized by price levels. You can select the maximum quantity of levels this indicator displays by using the script's "Levels" input. If the profile's height is small enough for level increments to be less than the symbol's tick size, a smaller quantity of levels is used until the profile's height grows sufficiently to allow your specified quantity of levels to be displayed. The exact position of levels is not tethered to the symbol's tick increments. Activity for one level is that which happens on either side of the level, halfway between its higher or lower levels. The lowest/highest levels in the profile thus appear higher/lower than the profile's low/high limits, which are determined by the lowest/highest points reached by price during the profile's life.
Level Values and Length
The profile's vertical structure is dynamic. As the profile's height changes with the price range, it is rebalanced and the price points of its levels may be recalculated. When this happens, past updates will be redistributed among the new profile's levels, and the level values may thus change. The new levels where updates are slotted will of course always be near past ones, but keep this fluidity in mind when watching level values evolve.
The profile's horizontal structure is also dynamic. The maximum length of level lines is controlled by the "Maximum line length" input value. This maximum length is always used for the largest level value in the profile, and the length of other levels is determined by their value relative to that maximum.
Updates vs Ticks
Strictly speaking, a tick is the record of a transaction between two parties. On TradingView, these are detected on seconds charts. On other charts, ticks are aggregated to form a chart update . I use the broader "update" term when it names both events. Note that, confusingly, tick is also used to name an instrument's minimal price increment.
Volume Quality
If you use volume, it's important to understand its nature and quality, as it varies with sectors and instruments. My Volume X-ray indicator is one way you can appraise the quality of an instrument's intraday volume.
█ FEATURES
Double-Sided Profiles
When you choose one of the first two configuration selections in the "Configuration" field's dropdown menu, you are asking the indicator to display a double-sided profile, i.e., where the down values appear on the left and the up ones on the right. In this mode, the formatting options in the top section of inputs apply to both sides of the profile.
Single-Sided Profiles
The six other selections down the "Configuration" field's dropdown menu select single-sided profiles, where one side aggregates the up/down values for either volume or ticks. In this mode, the formatting options in the top section of inputs apply to the left profile. The ones in the following "Right format" section apply to the right profile.
Calculation Mode
The "Calculation" input field allows the selection of one of two modes which applies to single-sided profiles only. Values can represent the simple total of volume or ticks at each level, or their delta. The mode has no effect when a double-sided profile is used because then, the total is represented by the sum of the left and right sides. Note that when totals are selected, all levels appear in the up color.
Age
The age of each level is always displayed as one of four line thicknesses. Thicker lines are used for the youngest levels. The age of levels is determined by averaging the times of the updates composing that level. When viewing double-sided profiles, the age of each side is calculated independently, which entails you can have a down level on the left side of the profile appear thinner than its corresponding up side level line on the right side because the updates composing the up side are more recent. When calculating the age of single-sided profiles, the age of the up/down values aggregated to calculate the side are averaged. Since they may be different, the averaged level ages will not be as responsive as when using a double-sided profile configuration, where the age of levels on each side is calculated independently and follows price action more closely. Moreover, when displaying two single-sided profiles (volume on one side and ticks on the other), the age of both sides will match because they are calculated from the same realtime updates.
Profile Resets
The profile can reset on timeframes or trend changes. The usual timeframe selections are available, including the chart's, in which case the profile will reset on each new chart bar. One of two trend detection logics can be used: Supertrend or the one used by LazyBear in his Weis Wave indicator . Settings for the trend logics are in the bottommost section of the inputs, where you can also control the display of trend changes and states. Note that the "Timeframe" field's setting also applies to the trend detection mechanism. Whatever the timeframe used for trend detection, its logic will not repaint.
Format
Formatting a profile for charts is often a challenge for traders, and this one is no exception. Varying zoom factors on your chart and the frequency of profile resets will require different profile formats. You can achieve a reasonable variety of effects by playing with the following input fields:
• "Resets on" controls how frequently new profiles are drawn. Spacing out profiles between bars can help make them more usable.
• "Levels" determines the maximum quantity of levels displayed.
• "Offset" allows you to shift the profile horizontally.
• "Profile size" affects the global size of the profile.
• Another "Size" field provides control over the size of the totals displayed above the profile.
• "Maximum line length" controls how far away from the center of the bar the lines will stretch left and right.
Colors
The color and brightness of levels and totals always allows you to determine the winning side between up and down values. On double-sided profiles, each side is always of one color, since the left side is down values and the right side, up values. However, the losing side is colored with half its brightness, so the emphasis is put on the winning side. When there is no winner, the toned-down version of each color is used for both sides. Single-sided profiles use the up and down colors in full brightness on the same side. Which one is used reflects the winning side.
Candles
The indicator can color candle bodies and borders independently. If you choose to do so, you may want to disable the chart's bars by using the eye icon near the symbol's name.
Tooltips
A tooltip showing the value of each level is available. If they do not appear when hovering over levels, select the indicator by clicking on its chart name. This should get the tooltips working.
Data Window
As usual, I provide key values in the Data Window, so you can track them. If you compare total realtime volumes for the profile and the built-in "Volume" indicator, you may see variations at some points. They are due to the different mechanisms running each program. In my experience, the values from the built-in don't always update as often as those of the profile, but they eventually catch up.
█ LIMITATIONS
• The levels do not appear exactly at the position they are calculated. They are positioned slightly lower than their actual price levels.
• Drawing a 20-level double-sided profile with totals requires 42 labels. The script will only display the last 500 labels,
so the number of levels you choose affects how many past profiles will remain visible.
• The script is quite taxing, which will sometimes make the chart's tab less responsive.
• When you first load the indicator on a chart, it will begin calculating from that moment; it will not take into account prior chart activity.
• If you let the script run long enough when using profile reset criteria that make profiles last for a long time, the script will eventually run out of memory,
as it will be tracking unmanageable amounts of chart updates. I don't know the exact quantity of updates that will cause this,
but the script can handle upwards of 60K updates per profile, which should last 1D except on the most active markets. You can follow the number of updates in the Data Window.
• The indicator's nature makes it more useful at very small timeframes, typically in the sub 15min realm.
• The Weis Wave trend detection used here has nothing to do with how David Weis detects trend changes.
LazyBear's version was a port of a port, so we are a few generations removed from the Weis technique, which uses reversals by a price unit.
I believe the version used here is useful nonetheless because it complements Supertrend rather well.
█ NOTES
The aggregated view that volume and tick profiles calculate for traders is a good example of one of the most useful things software can do for traders: look at things from a methodical, mathematical perspective, and present results in a meaningful way. Profiles are powerful because, if the volume data they use is of good enough quality, they tell us what levels are important for traders, regardless of the nature or rationality of the methods traders have used to determine those levels. Profiles don't care whether traders use the news, fundamentals, Fib numbers, pivots, or the phases of the moon to find "their" levels. They don't attempt to forecast or explain markets. They show us real stuff containing zero uncertainty, i.e., what HAS happened. I like this.
The indicator's "VPAA" chart name represents four of the five dimensions the indicator displays: volume, price, activity and age. The time dimension is implied by the fact it's a profile — and I couldn't find a proper place for a "T" in there )
I have not included alerts in the script. I may do so in the future.
For the moment, I have no plans to write a profile indicator that works on historical bars. TradingView's volume profiles already do that, and they run much faster than Pine versions could, so I don't see the point in spending efforts on a poor ersatz.
For Pine Coders
• The script uses labels that draw varying quantities of characters to break the limitation constraining other Pine plots/lines to bar boundaries.
• The code's structure was optimized for performance. When it was feasible, global arrays, "input" and other variables were used from functions,
sacrificing function readability and portability for speed. Code was also repeated in some places, to avoid the overhead of frequent function calls in high-traffic areas.
• I wrote my script using the revised recommendations in the Style Guide from the Pine v5 User Manual.
█ THANKS
• To Duyck for his function that sorts an array while keeping it in synch with another array.
The `sortTwoArrays()` function in my script is derived from the Pine Wizard 's code.
• To the one and only Maestro, RicardoSantos , the creative volcano who worked hard to write a function to produce fixed-width, figure space-padded numeric values.
A change in design made the function unnecessary in this script, but I am grateful to you nonetheless.
• To midtownskr8guy , another Pine Wizard who is also a wizard with colors. I use the colors from his Pine Color Magic and Chart Theme Simulator constantly.
• Finally, thanks to users of my earlier "Delta Volume" scripts. Comments and discussions with them encouraged me to persist in figuring out how to achieve what this indicator does.

Market Delta Volume for Realtime BarsWhat is it?
Market Delta Volume Tool for real-time bars
A market delta tool that shows, (1) the volume that got transacted on upticks - or the market buy volume; (2) the volume that got transacted on downticks - or the market sell volume (3) the market delta volume (i.e., market buy volume - market sell volume); (4) the total volume (market buy volume + market sell volume + neutral volume); and (4) the volume that got transacted without a change in price - or the neutral volume (total volume = market buy volume + market sell volume + neutral volume)
NOTE: THIS WORKS ONLY ON REAL-TIME BARS, NOT ON HISTORICAL BARS! The dotted line marks the start of real-time data (i.e., the bar from which the indicator started collecting and displaying data). You will see accurate data only for bars to the right of this line.
The longer you keep a chart open with the study enabled, the more data it collects and displays and the better your analysis can potentially be.
Note that the data gets reset every time any of the options is changed, the market is switched, the browser is refreshed, or the script is reloaded.
DATA ISN'T STORED. I.e., every time a new symbol is loaded/or the same symbol is reloaded, data gets refreshed.
Who is it for?
For traders who are used to analyzing buy/sell activity using market delta information. Especially, short-term trader/scalpers who are used to keeping the same chart open through the trading session.
Also for traders to see and study how anomalies in volume can give clues to buyer/seller absorption, initiative buying/selling etc.
Can be used to better understand VSA as well, although not necessary.
Essentially, this gives real-time delta volume information; use it however you see fit.
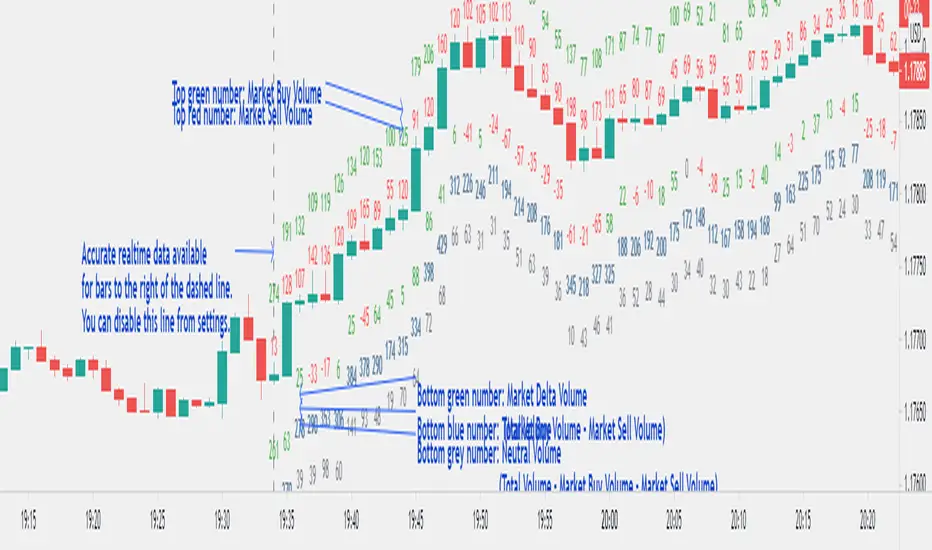
Smart Money Breakout Channels [AlgoAlpha]🟠 OVERVIEW
This script draws breakout detection zones called “Smart Money Breakout Channels” based on volatility-normalized price movement and visualizes them as dynamic boxes with volume overlays. It identifies temporary accumulation or distribution ranges using a custom normalized volatility metric and tracks when price breaks out of those zones—either upward or downward. Each channel represents a structured range where smart money may be active, helping traders anticipate key breakouts with added context from volume delta, up/down volume, and a visual gradient gauge for momentum bias.
🟠 CONCEPTS
The script calculates normalized price volatility by measuring the standard deviation of price mapped to a scale using the highest and lowest prices over a set lookback period. When normalized volatility reaches a local low and flips upward, a boxed channel is drawn between the highest and lowest prices in that zone. These boxes persist until price breaks out, either with a strong candle close (configurable) or by touching the boundary. Volume analysis enhances interpretation by rendering delta bars inside the box, showing volume distribution during the channel. Additionally, a real-time visual “gauge” shows where volume delta sits within the channel range, helping users spot pressure imbalances.
🟠 FEATURES
Automatic detection and drawing of breakout channels based on volatility-normalized price pivots.
Optional nested channels to allow multiple simultaneous zones or a clean single-zone view.
Gradient-filled volume gauge with dynamic pointer to show current delta pressure within the box.
Three volume visualization modes: raw volume, comparative up/down volume, and delta.
Alerts for new channel creation and confirmed bullish or bearish breakouts.
🟠 USAGE
Apply the indicator to any chart. Wait for a new breakout box to form—this occurs when volatility behavior shifts and a stable range emerges. Once a box appears, monitor price relative to its boundaries. A breakout above suggests bullish continuation, below suggests bearish continuation; signals are stronger when “Strong Closes Only” is enabled.
Watch the internal volume candles to understand where buy/sell pressure is concentrated during the box. Use the gauge on the right to interpret whether net pressure is building upward or downward before breakout to anticipate the direction.
Use alerts to catch breakout events without needing to monitor the chart constantly 🚨.

Polarity-VoVix Fusion Index (PVFI) Polarity-VoVix Fusion Index (PVFI) - Order Flow and Volatility Regime Detector
The PVFI is a next-generation indicator that fuses the Order Flow Polarity Index (OFPI) with a proprietary VoVix Volume Delta (VVD) engine. This tool is designed for traders who want to see not just how much volume is trading, but who is in control and how volatility is shifting beneath the surface.
What Makes PVFI Standout from the rest?
- Dual Engine: PVFI combines two advanced signals:
* OFPI: Measures real-time buy/sell pressure using candle body position and volume, then smooths it with a T3 moving average for clarity and responsiveness.
* VVD: Captures the "volatility of volume delta" - a normalized, memory-boosted measure of aggressive buying/selling, with a custom non-linear clamp for organic, non-pegged signals.
- Visual Clarity: Neon-glow OFPI line and shadowed, color-gradient VVD area make regime shifts and momentum instantly visible.
- Adaptive Dashboard: Toggle between a full-featured dashboard (desktop) and a compact info line (mobile) for seamless use on any device.
- Universal: Works on any asset - crypto, stocks, futures, forex - and any timeframe.
- No Chart Clutter: Clean, modern visuals and toggles for a pro look.
Inputs:
OFPI Lookback Length (ofpi_len): Sets the window for order flow pressure calculation. Shorter = more sensitive, longer = smoother. For scalping, try 5-10. For swing trading, 15-30. Crypto often benefits from shorter windows due to volatility.
OFPI T3 Smoothing Length (t3_len): Controls the smoothness of the OFPI line. Lower = more responsive, higher = smoother. Use 3-7 for fast markets, 8-15 for slow or higher timeframes.
OFPI T3 Volume Factor (t3_vf): Adjusts the T3’s sensitivity. Higher = more responsive, lower = more stable. 0.6-0.8 is typical. Raise for more “snappy” signals, lower for less noise.
VVD Delta Lookback (delta_len): Sets the window for VVD’s volume delta calculation. 10-20 for most assets. Shorter for high-volatility, longer for slow markets.
VVD Volatility Normalization Length (vol_norm_len): Normalizes VVD by recent volume. 15-30 is typical. Use higher for assets with wild volume swings.
VVD Momentum Memory (momentum_mem): Adds a “memory” boost to VVD, amplifying persistent buying/selling. 2-5 is common. Lower for choppy markets, higher for trending.
Show Dashboard (showDash): Toggles the full dashboard table (best for desktop). Turn off for a minimalist or mobile setup.
Show Compact Info Line (showInfoLabel): Toggles a single-line info label (best for mobile). Turn on for mobile or minimalist setups.
How PVFI Works:
- OFPI Calculation: Splits each candle’s volume into buy/sell pressure based on where the close is within the range. Aggregates over your chosen lookback, then smooths with a T3 moving average for a neon, lag-minimized signal.
- VVD Calculation: Measures the “aggression” of volume (body-weighted), normalizes by recent volume, and applies a memory boost for persistent trends. Uses a custom tanh clamp for a natural, non-pegged range.
- Visuals: OFPI is plotted as a neon line (with glow). VVD is a color-gradient area with a soft shadow, instantly showing regime shifts.
- Dashboard/Info Line: Desktop: Full dashboard with all key stats, color-coded and branded. Mobile: Compact info line with arrows for quick reads.
How you'll use PVFI:
- Bullish OFPI (Teal Neon, Up Arrow): Buyers are dominating. Look for breakouts, trend continuations, or confirmation with your own system.
- Bearish OFPI (Green Neon, Down Arrow): Sellers are in control. Watch for breakdowns or short setups.
- VVD Positive (Teal Area): Aggressive buying is increasing. Confirm with price action.
- VVD Negative (Purple Area): Aggressive selling is increasing. Use for risk management or short bias.
- Neutral/Flat: Market is balanced or indecisive. Consider waiting for a clear regime shift.
- Dashboard/Info Line: Use the dashboard for full context, or the info line for a quick glance on mobile.
Tips:
- For scalping, use lower lookbacks and smoothing.
- For swing trading, increase lookbacks and smoothing for stability.
- Works on all assets and timeframes - tune to your style.
Why PVFI is Unique:
- Fusion of Order Flow and Volatility: No other indicator combines body-based order flow with a volatility-of-volume delta, both visualized with modern, pro-grade graphics.
- Adaptive, Not Static: PVFI adapts to market regime, not just price movement.
- Mobile-Ready: Dashboard and info line toggles for any device.
- No Chart Clutter: Clean, color-coded, and easy to read.
For Educational Use Only
PVFI is a research and educational tool, not financial advice. Always use proper risk management and combine with your own strategy.
Trade with clarity. Trade with edge.
— Dskyz , for DAFE Trading Systems
